Your customers leave breadcrumbs everywhere they go online. They click certain emails, spend time on specific pages, abandon carts at predictable moments, and engage with some social posts while scrolling past others. Data driven digital marketing services involve paying attention to these behavioral signals and using them to make smarter decisions about where you spend money and what messages you send.
The difference between guessing and knowing shows up in your results. When you look at what your customers do, you can spot which tactics work and which ones waste money, then adjust your approach based on real behavior instead of borrowed best practices.
What Is Data Driven Digital Marketing and Why Does It Matter?
Data driven digital marketing means you base your decisions on what customers do rather than what you think they might do. You look at website traffic patterns, social media engagement, email open rates, and purchase behavior to figure out where to spend your budget and what messages to send. The difference is simple: you’re responding to real signals instead of guessing.
When you can see which campaigns bring in leads or sales and which ones don’t, you stop funding the duds and put more behind what’s working. This isn’t about perfection—it’s about getting better information than “we’ve always done it this way” or “I have a good feeling about this channel.”
Differences Between Data Driven Marketing and Traditional Advertising
Traditional marketing casts a wide net based on demographics and hoped the message stuck. You’d target “women aged 25 to 45” or “small business owners” and wait months to find out if the campaign worked, usually after you’d already blown through the budget. Data driven marketing flips this around. You watch what people do, which emails they open, which pages they linger on, which CTAs get clicks, and adjust in real time.
Benefits of Adopting a Data Driven Strategy
The main benefit is clarity. You can see which campaigns bring in customers and which ones don’t, so you stop throwing money at things that aren’t working. No more waiting until the end of the quarter to realize you wasted half your budget. The messaging gets more relevant because it’s based on what people have already shown interest in.
You start noticing patterns that help you move faster. When certain behaviors signal that a customer might leave or that a prospect is ready to buy, you can act on it instead of missing the window. The information tells you what’s coming, so you’re not always reacting after it’s too late.
Common Data Sources for Marketing Success
Most of the information you need already sits in the tools you use every day. The trick is knowing which signals matter and how to connect them so you’re seeing the full picture instead of disconnected fragments:
- Website Analytics: Google Analytics shows you which pages people visit, how long they stay, and where they bail or convert.
- Social Media Engagement: Likes, shares, comments, and clicks tell you what content lands with your audience and what gets ignored.
- Email Performance Metrics: Open rates, click-throughs, and conversions show you if your messages work and when people prefer to hear from you.
- Customer Relationship Management Systems: Purchase history, support tickets, and past conversations give you the context of how someone has interacted with you over time.
- Mobile App Analytics: Usage patterns and feature adoption reveal what keeps people engaged and where they drop off.
- GPS and Route Performance Data: Location tracking on mobile activations shows which neighborhoods and times generate the most foot traffic and engagement.
Building a Data Driven Marketing Strategy
Getting this right means setting up three things: the tech that captures what people do, the ability to make sense of those numbers, and a system for turning what gets learned into different decisions. Start with tracking that covers the touchpoints that matter without drowning teams in useless metrics. Set up analytics platforms, implement tracking codes, and use consistent naming so anyone can pull up performance by campaign or channel without digging through a mess.
Someone needs to spot patterns in the numbers. A traffic spike doesn’t mean anything until it gets connected to that email blast or the blog post that went viral. Software handles the volume but people connect the dots. The gap between companies that have dashboards and companies that use them comes down to process. Schedule regular reviews, decide what thresholds trigger action, and give teams permission to adjust based on what they’re seeing instead of waiting for approval to change course.
Collecting and Interpreting Data for Effective Marketing Campaigns
Figure out what metrics matter for the business model first. Lead generation companies track form fills and demo requests. E-commerce sites watch cart additions and checkout drop-offs. A subscription business cares about completely different numbers than a one-time purchase company. Brands running mobile activations track foot traffic, sample distribution rates, and social media mentions during events.
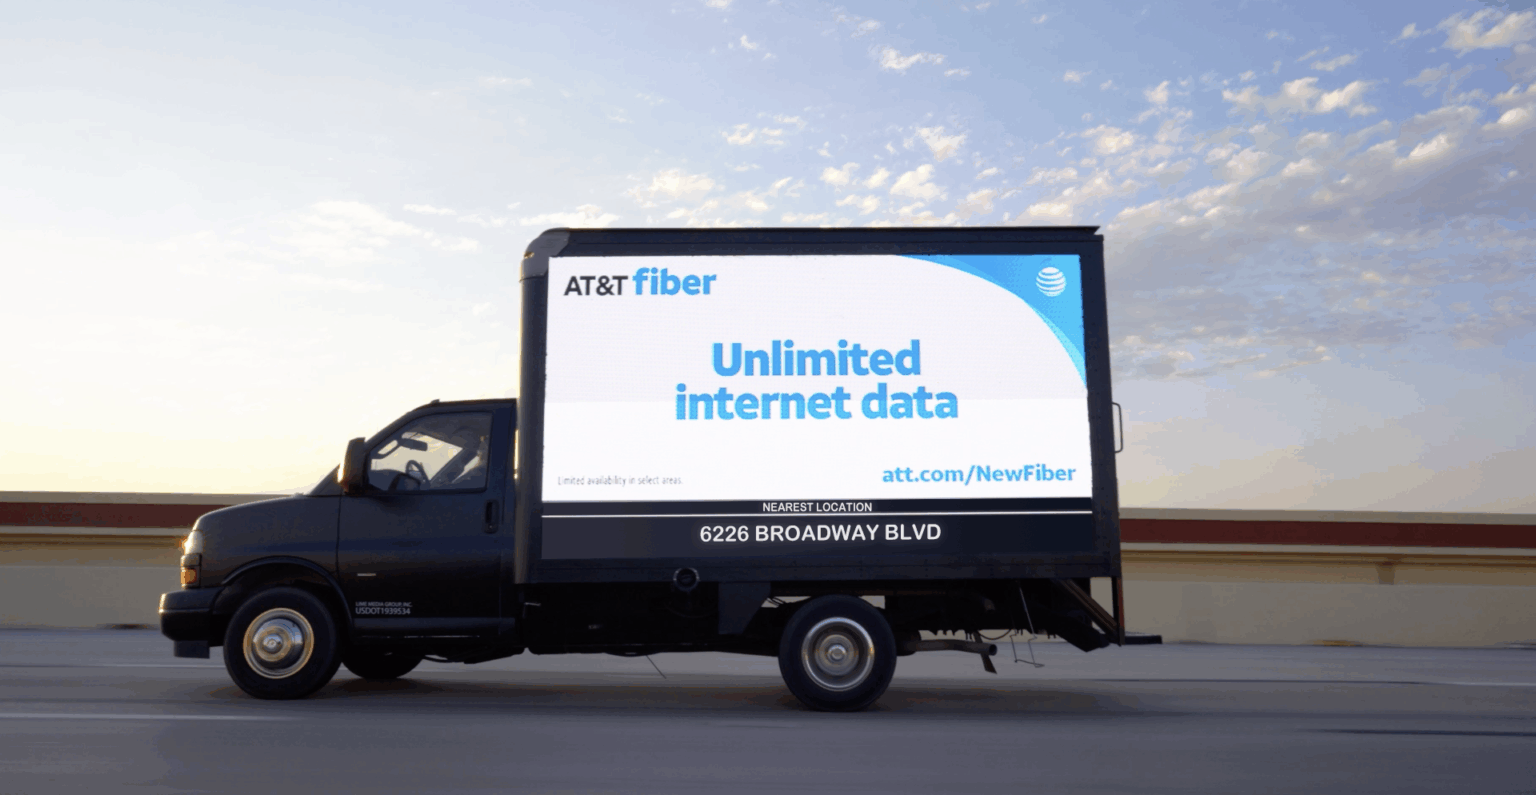
The technical setup depends on what platforms are in play, but it usually involves tracking codes, platform pixels, and CRM connections. GPS tracking on mobile vehicles shows which routes and neighborhoods generate attention. Someone running LED trucks through downtown areas can see which streets and times of day produce the most impressions based on foot traffic and vehicle positioning data.
Best Data Collection Methods for Understanding Customer Behavior
The methods worth using change based on what questions need answering. An e-commerce brand tracks different things than a service company, and trying to monitor everything creates noise instead of answers. Pick the methods that address the biggest unknowns first:
- Website Analytics Tracking: Page views, time on site, and conversion events show how people move through the site and where they take action.
- Form Analytics: Tracks where people bail on multi-step forms so friction points become obvious.
- Heat Mapping and Session Recording: Shows which parts of a page get attention and which get scrolled past without a glance.
- Customer Surveys and Feedback: Adds context to the numbers by asking people why they did what they did.
Applying Techniques to Interpret Data and Make Informed Decisions
Interpretation starts with knowing what normal looks like. A conversion rate means nothing without historical context to show whether it’s better or worse than usual. This stops teams from panicking over regular ups and downs while catching real problems that need attention. Segmentation shows what aggregate numbers hide. Overall traffic might look flat, but breaking it down by source could reveal organic search doubled while paid search tanked. Device type, location, and customer status all tell different stories when examined separately.
Look for connections between behaviors and outcomes. Customers who read blog posts before buying might stick around longer than those who don’t. Mobile app users might convert faster than website browsers. These patterns point to where effort pays off.
Descriptive analytics just tracks what already happened: email opens, social engagement, conversion rates by channel. This creates the baseline that makes future patterns recognizable.
How Brands Track Mobile Campaign Performance
Mobile campaigns generate measurable data across multiple touchpoints. Brands monitor foot traffic at activation sites, product distribution rates, social media mentions during and after events, and earned media impressions from press coverage and user-generated content. The performance data shows which cities, venues, and interactive elements produce the strongest engagement, allowing brands to adjust routing and creative elements mid-campaign.
CeraVe Drama-Free Cleansing Tour

CeraVe tracked engagement metrics across four major U.S. cities using a 32-foot stage trailer that served as a mobile showroom. The brand distributed 25,000 products to consumers who received skin consultations with certified dermatologists, played interactive games, and participated in city-specific giveaways.
The tour generated 60 million social impressions and directly engaged 16,000+ consumers through personalized consultations that matched cleanser products to individual skin types. The activation featured a branded green screen photo op and design elements inspired by the “Cleanse Like a Derm” soap opera campaign starring Xochitl Gomez and Dr. Dustin Portela.
Olivia Rodrigo GUTS Bus Tour

IHEARTCOMIX measured fan engagement across 45 cities during the GUTS bus tour, tracking attendance and earned media impressions from a custom 34-foot school bus. The activation attracted 81,600+ attendees and generated 90 million earned media impressions through fan-created content featuring the crescent moon photo op, glitter toilet, SOUR tour wardrobe displays, and mirrored vanity.
Brand partnerships with American Express, Sony, and Dr. Martens amplified engagement through exclusive merchandise opportunities. The tour’s performance data informed reactivation decisions for Olivia Rodrigo’s Netflix film premiere and Lancôme beauty collaboration, with the campaign winning multiple industry awards.
Turn Campaign Data Into Smarter Mobile Marketing Decisions
Lime Media operates 250+ mobile vehicles, including LED trucks, glass display units, custom trailers, and 3D product replicas. We handle everything from vehicle fabrication and route planning to staffing and activation management across the US and Canada. Our custom builds include giant driving almonds, monster trucks, gold bars, and product-shaped vehicles that generate social media attention. Contact us to discuss your next mobile campaign.
Frequently Asked Questions
How can I connect my marketing campaigns to business outcomes?
Connecting campaigns to business outcomes means tracking the actions that actually matter to revenue like lead submissions, purchases, and how long customers stick around. Set up the right tracking and configure analytics platforms properly so you can see which campaigns drive real growth versus just racking up impressions.
What analytics platforms should I use without overwhelming my team?
Most businesses start with Google Analytics for website behavior, their email platform’s built-in analytics, and social media insights. Pick platforms that talk to each other so you get one clear picture of customer activity rather than juggling a dozen disconnected tools.
Why does making ongoing adjustments work better than launching campaigns and hoping for the best?
You learn from what customers actually do and tweak based on that feedback rather than launching something and crossing your fingers. Small weekly changes like cutting underperformers and doubling down on winners compound into serious growth.